The email arrives on Thursday afternoon. One of your leads is asking for another week on the dev phase.
You say yes. You reshuffle the client delivery. You apologize. Then you start the post-mortem in your head: how did a project that looked green last week turn red overnight?
Here is the most common answer: it was not overnight. The person who just asked for more time has been running at 110% capacity for three weeks. The signal was in your time logs the whole time. Nobody read it.
Only 35% of projects finish on time and on budget. Most overruns trace back not to bad planning but to teams running above sustainable capacity with no one catching it early enough to act. The irony is that 86% of organizations say they do capacity forecasting. Only 6% say they are effective at it.
The gap between those two numbers is where your deadline slips are hiding.
What overload actually looks like in time-tracking data
Overload has a specific signature in time logs. It does not show up in status calls. It shows up as numbers.
Three signals are worth watching every week.
Hours over 9 per day, sustained. One big day is not a pattern. Three consecutive days above 9 logged hours means someone is drawing from reserve capacity. The pace you see in week two is not repeatable in week four.
More than four project codes in a single day. When a team member touches five different project codes before 5pm, context switching is eating their productive time. Recovery from a single context switch takes 23 minutes. Multiply that by five project pivots and you lose nearly two hours of real output before any single task actually slows down.
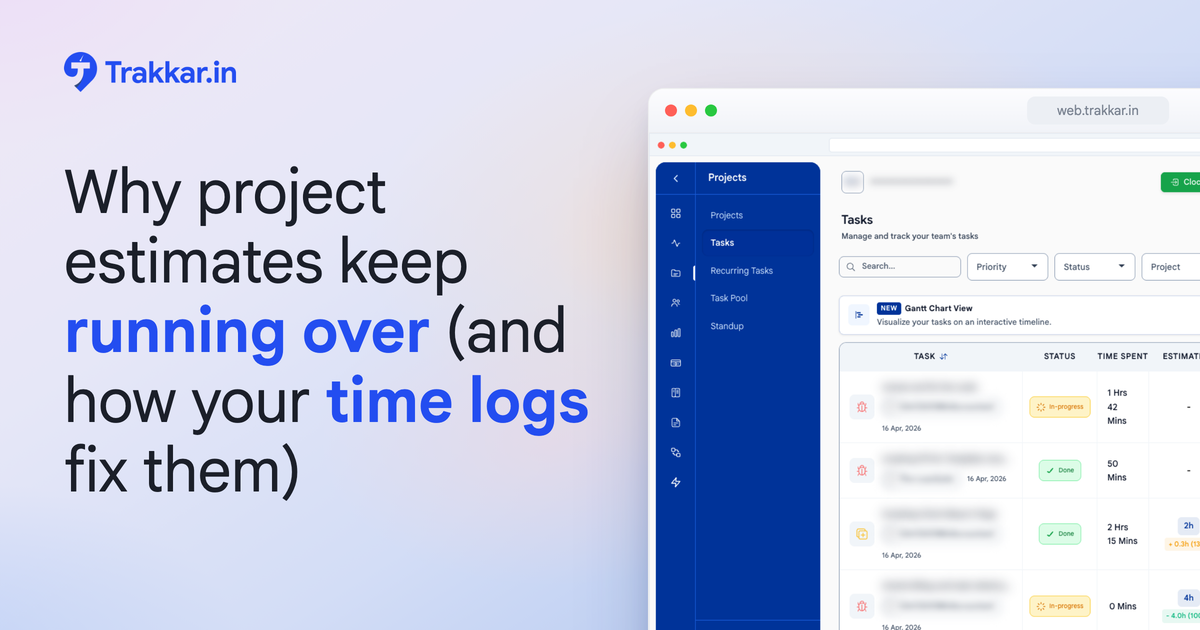
Clocked-in time that is significantly higher than project-tagged time. If someone is clocked in for 9 hours but only 6.5 hours are tagged to a project, that 2.5-hour gap is real work: coordination overhead, rework, Slack threads that consumed a morning. The person is working. The work is just not showing up where you can see it.

The reason most managers miss these signals is structural. They review time logs by project, not by person. "How is the Acme rebrand tracking?" The project looks fine. Somebody ran hard to keep it on track. The project view tells you the deliverable is fine. The person view tells you who absorbed the cost.
Why the warning never reaches you until it is too late
There are two reasons overload stays invisible until a deadline slips.
The first is the question you ask. Most weekly check-ins ask people to report on project status: on track, blocked, or at risk. That framing invites people to report on the deliverable, not on their own capacity. A developer running at 115% with a sprint that still looks on track will say "on track." She is answering your question correctly.
The second is the culture of high-performing teams. In most agencies and product teams, flagging personal overload feels like asking for special treatment. So people absorb the strain until they cannot.
"I didn't say anything because I thought I could push through. By the time I realized I couldn't, we had one week left and no room to adjust anything."
By the time overload surfaces in a status call, you have three to five days of options. The project has already been affected. The rework has already been done. The question is now damage control, not prevention.
The fix is not asking better questions. It is reading data that your team generates every day and that currently sits unread in a time log.
How to read time data as a capacity signal
This check takes 15 minutes per week. You do not need a new tool or a new process. You need a different cut on data you already have.
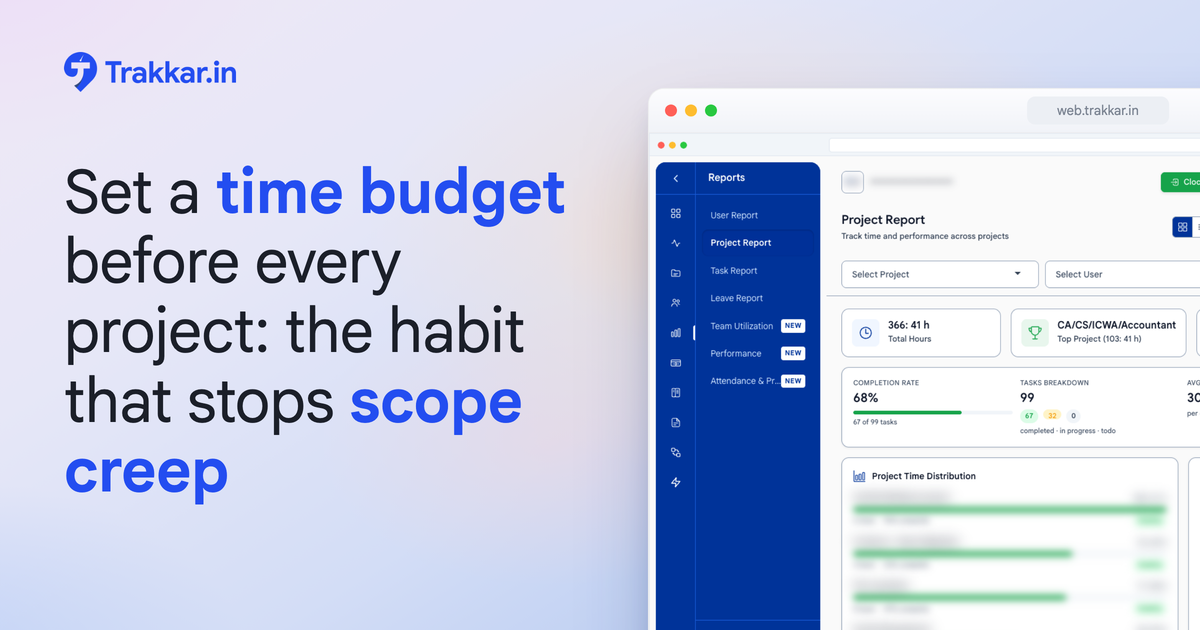
Cut 1: Hours by person, not by project. Pull last week's logged hours for each person. Set 85% utilization as your watch threshold. For a 40-hour week, that is 34 hours. Anyone averaging above 38 hours per week for two consecutive weeks goes on your watch list, not because 38 hours is wrong, but because sustained 95%+ utilization leaves no buffer for anything that goes sideways.
Cut 2: Project codes per person per week. For each person on your watch list, count the distinct project codes in their logs. More than four active projects per person per week is a context-switching problem. Even if the total hours look manageable, the attention fragmentation is not.
Cut 3: Clocked-in time versus project-tagged time. Subtract total project-tagged hours from total clocked-in hours. A gap of more than 2 hours per day, sustained, is overhead that is not getting captured. The real workload is higher than the log shows.
Trakkar's team productivity dashboard shows utilization by team member in real time, so you can see who is running hot before Friday rolls around. The reports and analytics view lets you slice the same data by person rather than by project, which is the cut that reveals capacity strain instead of masking it.
What this looks like with real numbers
A 12-person digital agency was four weeks into a website overhaul for a retainer client. Two developers were the named leads.
In week two, their logged hours hit 54 and 57 respectively. The sprint target assumed 40 each. Neither mentioned it in the weekly call. Both said the project was on track.
By week four, one developer asked for an extension on the final feature. The client pushed back. The agency absorbed six hours of rework per developer at $90 per hour.
Cost: $1,080 in uncompensated work on a project already at its billing ceiling.

The hours over 40 per week showed up in the time logs in week two. No one reviewed the data by person. The project view showed green. The person view would have shown two people already past a sustainable pace.
A 15-minute review in week two would have surfaced the conflict while there was still time to adjust scope, reassign one deliverable, or have a proactive conversation with the client about the timeline. None of those options were available in week four.
What to do this week
You do not need a new system. You need five specific actions, using data you already have.

Monday: Pull last two weeks of time logs per person. Sort by total hours logged, descending. Flag anyone averaging above 38 hours per week. That is your watch list for the week.
Tuesday: Count active project codes per person on the watch list. Open each flagged person's log for last week. Count distinct project codes. More than four is a context-switch flag worth a short conversation.
Wednesday: Compare clocked-in time to project-tagged time. For each flagged person, subtract tagged hours from clocked-in hours. A gap over 2 hours per day means unrecorded overhead. The real workload is higher than it appears.
Thursday: Have a 15-minute data-backed check-in with your top two flagged people. Bring the numbers. Not as a performance question. As a resource question. "Your logs show 57 hours last week and six active projects. Is there something we should shift?" That framing gets honest answers. A vague check-in does not.
Friday: Set a recurring utilization review as a standing 5-minute agenda item. Not a deep audit. A scan. Utilization above 85%, sustained for two weeks, gets a conversation before the third week starts.
Start with one person you already suspect is stretched thin. Pull their last two weeks of time data before your next one-on-one. The pattern you find will be more convincing than any process change.
One concrete next step
If you want to see your team's current utilization per person in one view, Trakkar's time tracking and team productivity dashboards give you that breakdown daily, sorted by person rather than by project.
If you would rather see what that looks like for your specific team first, book a 20-minute demo. We will show you who on your team is running above 85% capacity right now, and where the data to catch it earlier has already been sitting.